[Note: this page is displayed for archiving purposes and may contain outdated information.]
N-PRINT is an integrated nitrogen footprint model that is still in progress. Ultimately it will describe:
1) How much N is released to the environment;
2) Where that N will be released and the form it will take;
3) How the N emissions may circulate and where they may be deposited; and
4) What impacts to ecological and human health may result.
The N-PRINT tool relates the N-Calculator and the planned tools for producers (N-Producer) and policymakers (N-Policy). The conceptual figure lays out the linkages among these tools. Please read on for more information about each tool!
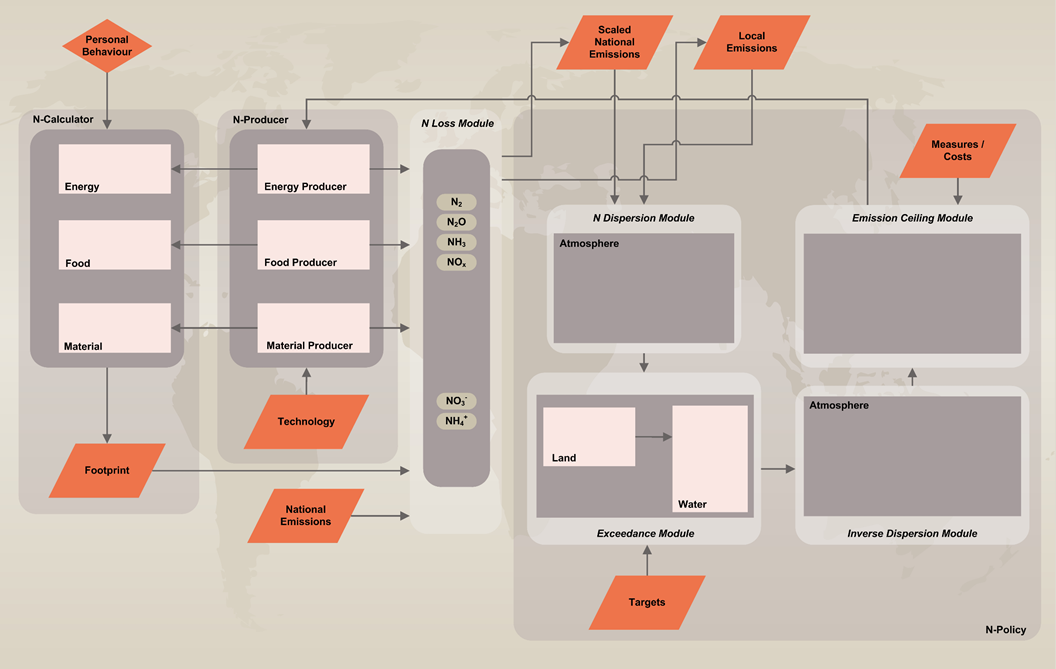
Figure 1: Conceptual Diagram of N-PRINT
The first tool, N-Calculator, encompasses the current effort to develop a nitrogen footprint model that shows a user how much nitrogen his or her activities release to the environment. N-Calculator asks users questions about their energy use (electricity use, transportation, etc.), food consumption (what types and amounts of foods are consumed), and ultimately will cover material consumption (goods and services).
The second tool, N-Producer, will show how producers (farmers and others) can decrease their N footprint while still creating products that are successful in the market. This module has a clear link with N-Calculator, since changes on the producers’ side of the whole cycle will have an immediate effect for the overall footprint of the consumers. When using this tool, farmers will answer questions about their farming practices, such as crop type and fertilizer application rate. After learning their farm’s nitrogen footprint, they will then be able to see how changing their farming practices could reduce the amount of nitrogen released from their farm.
There is another link with the third tool: N-Policy. N-Policy will eventually determine emission ceilings for reactive nitrogen for regions, which will show how much nitrogen can be released in these regions without a major negative impact on the environment. These ceilings from the N-Policy tool can then be used to help develop policies in regions to limit and reduce nitrogen emissions below amounts that would adversely impact the environment.
The N-Policy tool consists of different modules, together providing the regionalized emission ceilings. These modules are: N dispersion module, Exceedance module, Inverse dispersion module and Emission ceiling module. The N dispersion module determines where the released nitrogen will eventually be transported and/or deposited to. Based on regionalized emission data (delivered by the N Loss module), the N dispersion module will calculate the dispersion and/or deposition by means of different models. Depending on e.g. the input data availability these can range from complex transport and deposition models to simple empirical models.
Based on the concentration and/or deposition data delivered by the N dispersion module, the Exceedance module will then determine the extent to which specific targets are exceeded (like e.g. critical loads, air and water quality targets). If exceedances occur, the Emission ceiling module can then calculate the maximum emission that can still be allowed in a specific region, without compromising these environmental limits. The Inverse dispersion module will deliver important input to the Emission ceiling module, since it provides information about the inverse transport routes of the different nitrogen components (i.e. not describing the source-receptor route, but the receptor-source route).
Together with information about measures and their costs, the Emission ceiling module can show how the targets can be reached in a cost effective way, by providing information about the possibilities for emission trading between different stakeholders/emitters within the region. Within the calculated emission ceiling the region is free (within certain limits) to make choices on how the reactive nitrogen is produced (agriculture, traffic, industry, energy production, etc.). The nitrogen production within the region might then be tradable among the sources, as long as the ceiling is not exceeded.
The earlier mentioned module called N Loss uses the output from N-Calculator and/or N-Producer to spatially define where the nitrogen emissions are released and the form that they take, such as nitrous oxide or ammonia. This module includes N losses to ground and surface waters.
Together, all of the parts of the integrated N-PRINT model will provide a clear picture of the nitrogen releases in a region. This information will educate regions and empower them to reduce their impact on the environment.
While developed for use in nitrogen-rich regions, it is important to note that N-PRINT can also be used in nitrogen-poor regions to show how increases in resource use (food, energy) will contribute to N losses to the environment.