The Takeaway:
-
- Japan is a country known for its unique traditional food culture and diet but nowadays Japan highly depends on import for food and animal feed.
- After increasing its nitrogen footprint of 9.5 kg N cap–1 yr–1 in 1961 to 23.7 kg N cap–1 yr–1 in 1993, Japan's N-footprint has steadily decreased to 18.7 kg N cap–1 yr–1 in 2010.

Country Background
-
- Japan is a developed country mainly driven by secondary and tertiary industries with high energy consumption. GDP in 2015 was 4.17 million JPY cap–1 yr–1. Per capita final energy consumption in 2015 was 106.3 GJ cap–1 yr–1, approximately double of the world mean (Hayashi et al., 2021).
- Japan has a population of approximately 125 million and is an aging country with the ratio of population aged 65 years or over in 2015, 26.6%.
- Japan experienced severe air and water pollution induced by the rapid economic growth with industrialization and motorization in 1950s and 1960s. This prefaced the pollution controls from the policies and technological measures implemented in the 1970s. Pollution control is now well achieved.
- The economy-wide new N input in 2015 was 5.9 Tg N yr–1 = 47 kg N cap–1 yr–1 (Hayashi et al., 2021).
- Trends in Reactive Nitrogen Loss to the Environment (TRNLE) in 2015 was 14.6 kg N cap–1 yr–1 (Hayashi et al., 2021).
- Trends in Nitrogen Deposition (TND) in 2015 was 10.2 kg N ha–1 yr–1 (Hayashi et al., 2021).
- Nitrogen use efficiency (NUE) of crop production in 2015 was 29.7% (Hayashi et al., 2021).
- NUE of livestock production in 2015 was 20.4% (Hayashi et al., 2021); note that the NUE of import animal feed is assumed to be 100%.
- NUE of fish production in 2015 was 424.5% (wild caught and aquaculture) (Hayashi et al., 2021).
- NEU of whole food system in 2015 was 33.9% (Hayashi et al., 2021); note that the NUE of import food and animal feed is assumed to be 100%.
- Nitrogen use efficiency of crop production in 2015 was 29.7% (Hayashi et al., 2021).
- Japanese diet is diverse and rich but depends on import much for food and animal feed. The Japanese diet in the 1970s has been recommended for both health and N footprint reasons ( Oita et al., 2018). The self-sufficiency ratio of food (calory basis) in 2015 was 39% and that of animal feed (TDN: total digestible nutrients) was 28%.
- Domestic agriculture, forestry, and fisheries have challenges in their economic and resource sustainability.
- The nitrogen pollution embedded in international trade was largest in Japan in 2012, i.e., a net value of 3.3 Tg N yr–1 to exporting countries (Oita et al., 2016a).
Japan's N-Footprint - By the Numbers
-
- Japanese food nitrogen footprint increased from 9.5 kg N cap–1 yr–1 in 1961 to 23.7 kg N cap–1 yr–1 in 1993, then turned to a decreasing trend, e.g., 17.9 kg N cap–1 yr–1 in 2013 (Figure 2).
- In 1961 (Figure 3), the largest category in food nitrogen footprint was cereals (mostly rice; 24.5%), then dairy (16.7%), soybeans (15.2%), and eggs (10.9%).
- In 2013 (Figure 4), the largest category in food nitrogen footprint was meat (35.0%), then dairy (17.7%), cereals (rice, wheat, and others; 11.2%), and eggs (11.0%).
- Although fish-derived nitrogen supply accounts for ca. 20% net supply (Fig. 1), its nitrogen footprint was not high owing to wild caught.
In the News:
Leaflet of the Sustai-N-able, a 5-year project funded by the Research Institute for Humanity and Nature, Japan (PL: Kentaro Hayashi, RIHN). https://www.chikyu.ac.jp/Sustai-N-able/documents/SusN_brochure-en.pdf
Figures:
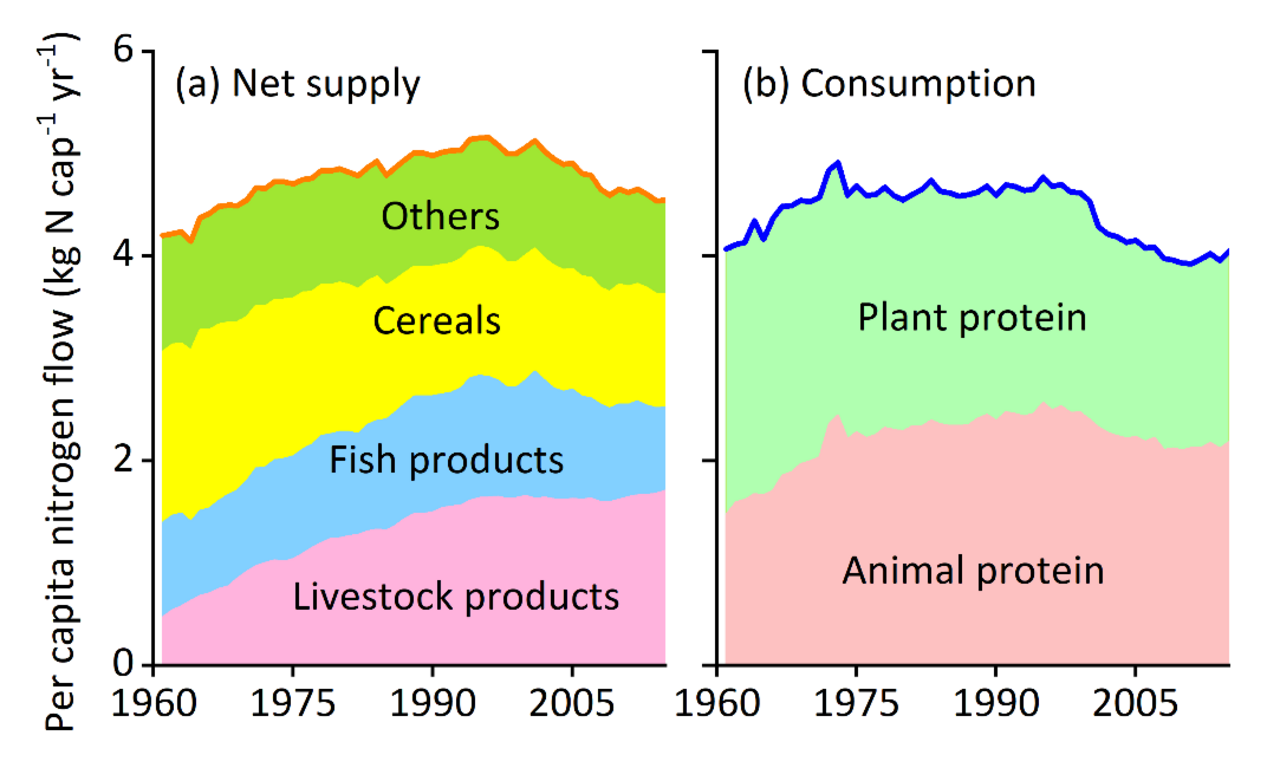
Figure 1. (a) Per capita net food supply and (b) per capita food consumption in Japan (Hayashi et al., 2018).
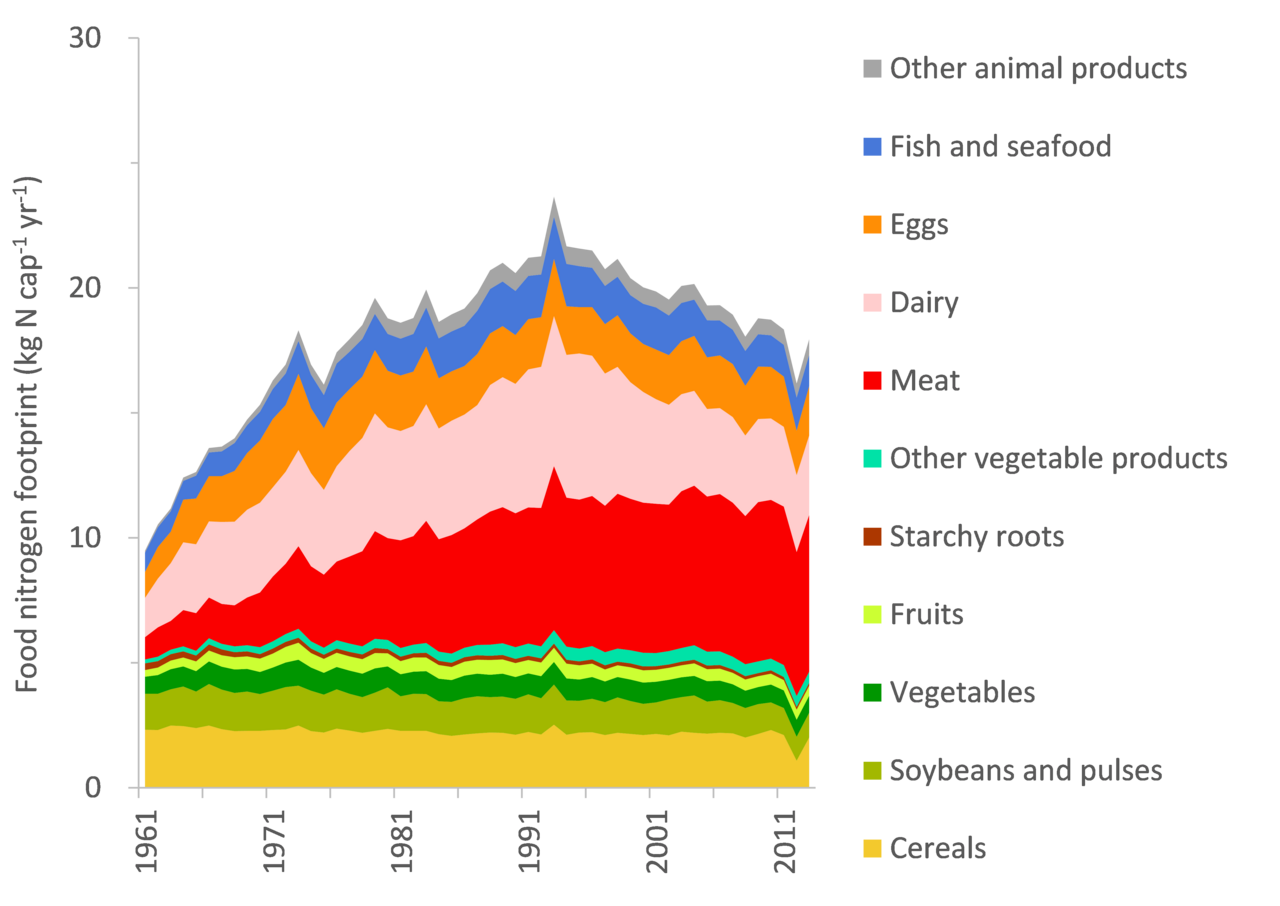
Figure 2. Food nitrogen footprint in Japan (modified from Oita et al., 2020).
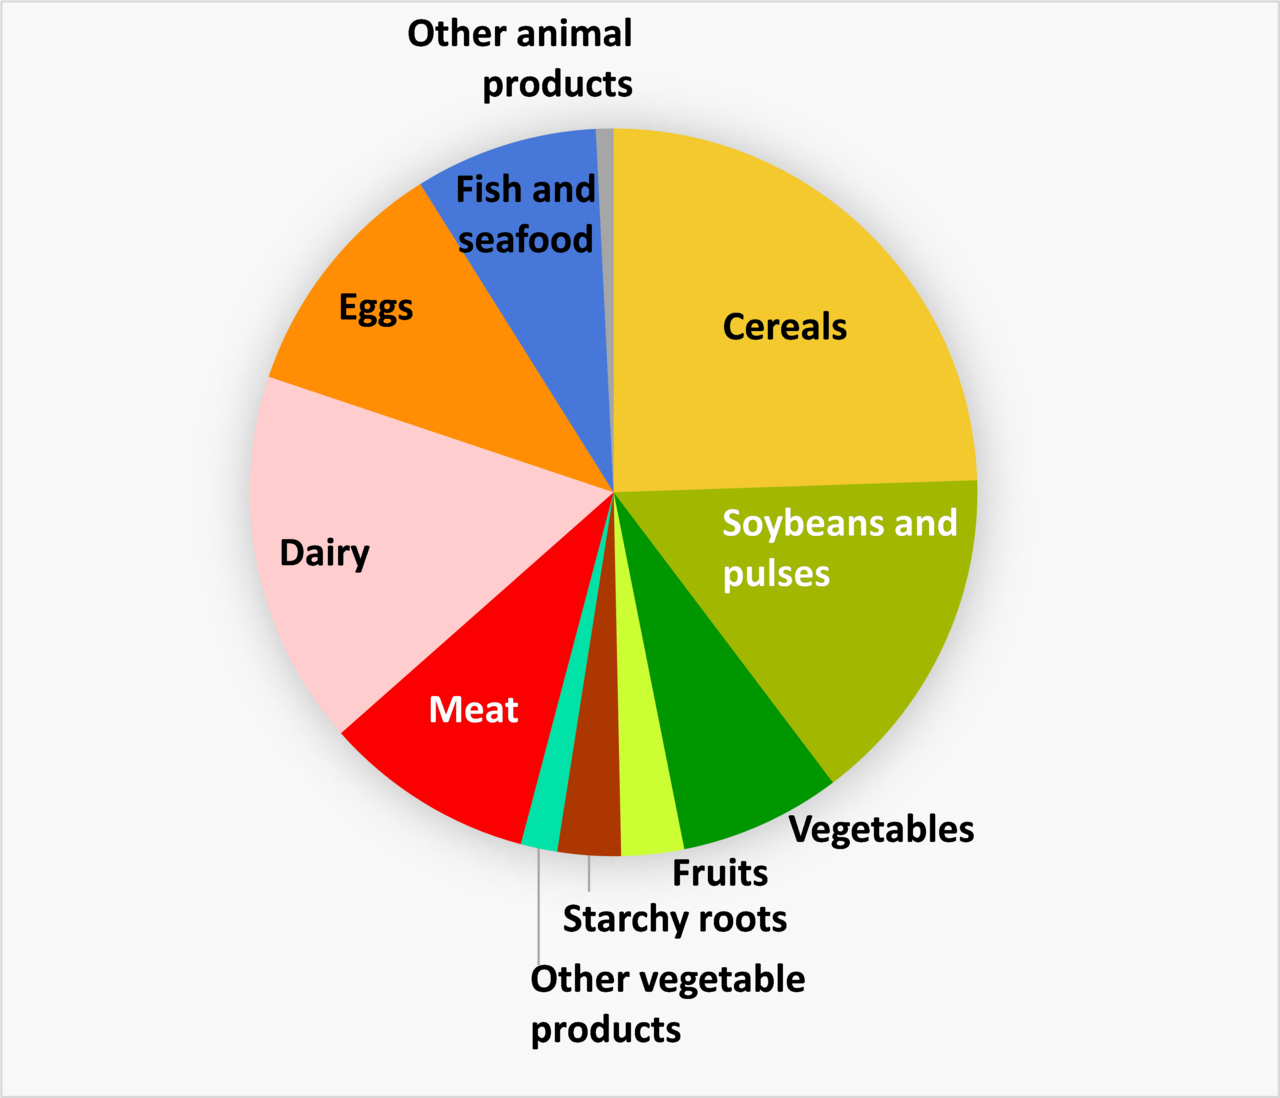
Figure 3. Food nitrogen footprint in Japan in 1961 by category, 9.5 kg N cap–1 yr–1 in total (modified from Oita et al., 2020).
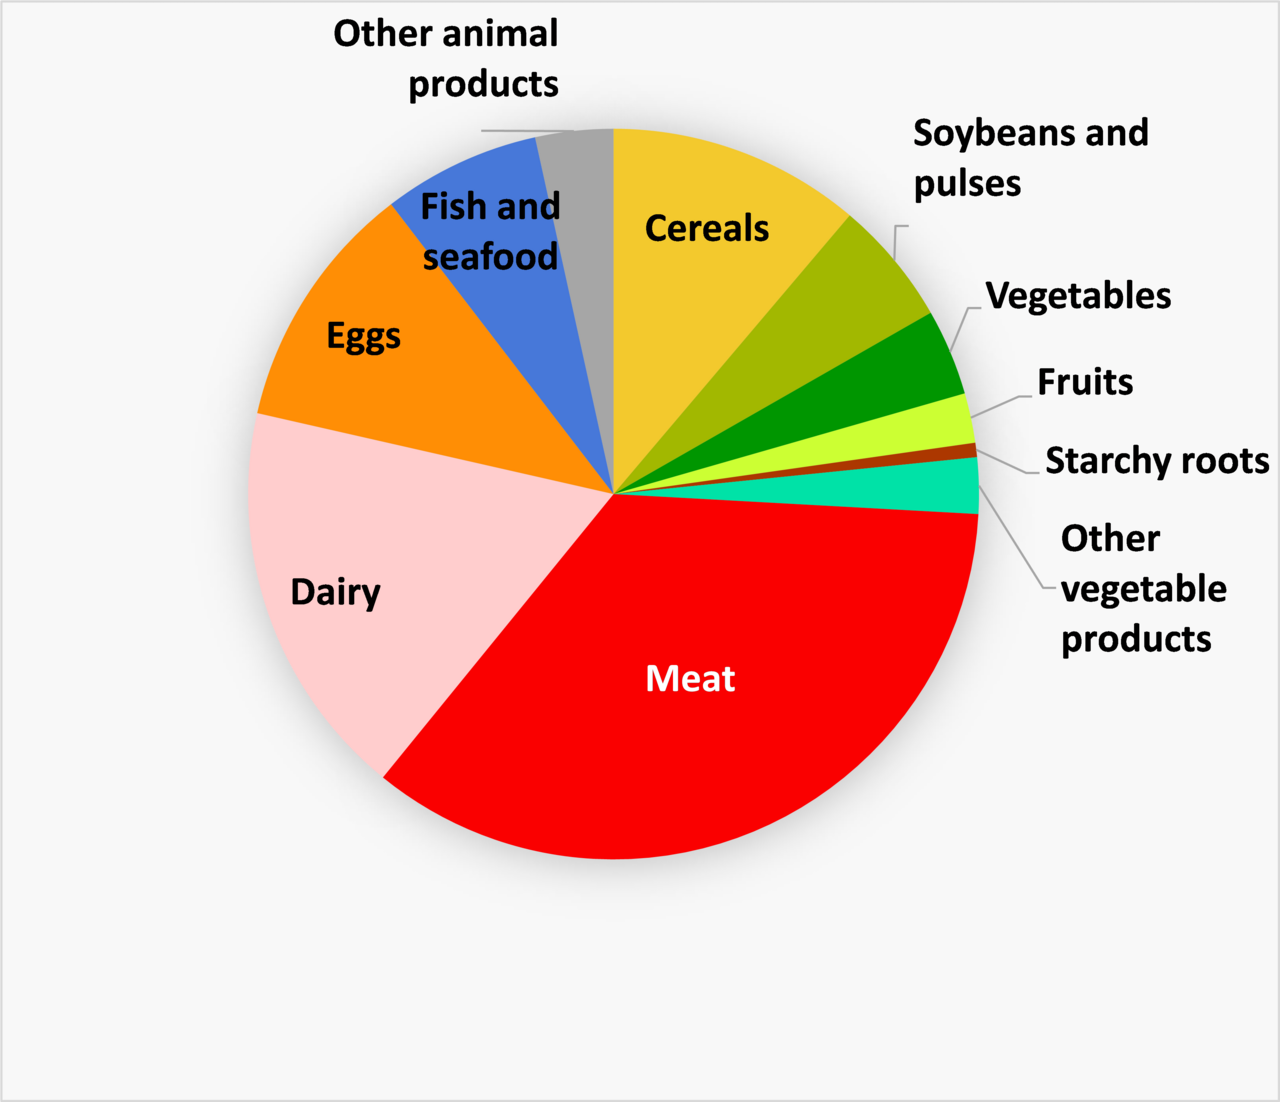
Figure 4. Food nitrogen footprint in Japan in 2013 by category, 17.9 kg N cap–1 yr–1 in total (modified from Oita et al., 2020).
References
-
Hayashi, K., Shibata, H., Oita, A., Nishina, K., Ito, A., Katagiri, K., Shindo, J., Winiwarter, W. (2021) Nitrogen budgets in Japan from 2000 to 2015: Decreasing trend of nitrogen loss to the environment and the challenge to further reduce nitrogen waste. Environmental Pollution, 286, 117559.
-
Hayashi, K., Nishina, K., Oita, A. (2020) Concealed nitrogen footprint in protein-free foods: an empirical example using oil palm products. Environmental Research Letters, 15, 035006.
-
Hayashi, K., Oita, A., Lassaletta, L., Shindo, J., Shibata, H., Sakurai, G., Eguchi, S. (2018) Reducing nitrogen footprints of consumer-level food loss and protein overconsumption in Japan, considering gender and age differences. Environmental Research Letters, 13, 124027.
-
Oita, A., Katagiri, K., Eguchi, T., Morioka, R., Shindo, J., Hayashi, K., Matsubae, K. (2021) Nutrient-extended input–output (NutrIO) method for the food nitrogen footprint. Environmental Research Letters, 16, 115010.
-
Oita, A., Wirasenjaya, F., Liu, J., Webeck, E., Matsubae, K. (2020) Trends in the food nitrogen and phosphorus footprints for Asia’s giants: China, India, and Japan. Resources, Conservation and Recycling, 157, 104752.
-
Oita, A., Nagano, I., Matsuda, H. (2018) Food nitrogen footprint reductions related to a balanced Japanese diet. Ambio, 47, 318–326.
-
Oita, A., Malik., A., Kanemoto, K., Geschke, A., Nishijima, S., Lenzen, M. (2016a) Substantial nitrogen pollution embedded in international trade. Nature Geosciences, 9, 111–115.
-
Oita, A., Nagano, I., Matsuda, H. (2016b) An improved methodology for calculating the nitrogen footprint of seafood. Ecological Indicators, 60, 1091–1103.
-
Shibata, H., Galloway, J.N., Leach, A.M., Cattaneo, L.R., Noll, L.C., Erisman, J.W., Gu, B., Liang, X., Hayashi, K., Ma, L., Dalgaard, T., Graversgaard, M., Chen, D., Nansai, K., Shindo, J., Matsubae, K., Oita, A., Su, M.-C. Mishima, S., Bleeker, A. (2017) Nitrogen footprints: Regional realities and options to reduce nitrogen loss to the environment. Ambio, 46, 129–142.
-
Shibata, H., Cattaneo, L.R., Leach, A.M., Galloway, J.N. (2014) First approach to the Japanese nitrogen footprint model to predict the loss of nitrogen to the environment. Environmental Research Letters, 9, 115013.
-
Shindo, J., Oita, A., Hayashi, K., Shibata, H. (2021) Comparison of food supply system in China and Japan based on food nitrogen footprints estimated by a top-down method. Environmental Research Letters, 16, 045003.
-
Shindo, J., Yanagawa, A. (2017) Top-down approach to estimating the nitrogen footprint of food in Japan. Ecological Indicators, 78, 502–511.
-
Sustai-N-able Project (2023) Leaflet. https://www.chikyu.ac.jp/Sustai-N-able/documents/SusN_brochure-en.pdf.
susn_brochure-en.pdf7.63 MB