The Takeaway
What we consume reflects not only on our health and well-being but on the environment surrounding us through the Nitrogen Footprint each of us leaves behind.
Importantly, food components contribute to 84% (!) of the total Nitrogen Footprint, with 65% (!) being lost to the environment during the food production chain and 19% being wasted upon food consumption. Consequently, personal food consumption choices directly reflect on the entire food production chain, along with related Nitrogen losses and wastes. Currently, there are numerous opportunities from which individuals can benefit in reducing their Nitrogen losses through a wide range of options, leading towards healthier and more sustainable dietary choices and greener transportation (more details in Medinets et al., 2024).
In addition, public awareness of current Nitrogen wastes and losses from agriculture, energy, wastewater, and solid waste due to insufficient management, as well as the governmental implications required to make it more sustainable, is imperative for beating N pollution.
Country Background
Ukraine, one of the largest European countries spanning 603,628 km² and situated in the Black Sea basin. The population in 2017 stood at 42.4 million people, excluding those residing in temporarily occupied territories like Crimea, Luhansk, and Donetsk regions, as this data was not maintained by the State Statistics Service of Ukraine (SSSU). In 2017, 69% of the population (29.4 million) resided in urban areas, but this distribution varied significantly by region, with Eastern Ukrainian administrative regions being urban-dominated and Western regions rural-dominated (Fig. 1). On average, a Ukrainian household comprised 2.58 individuals.
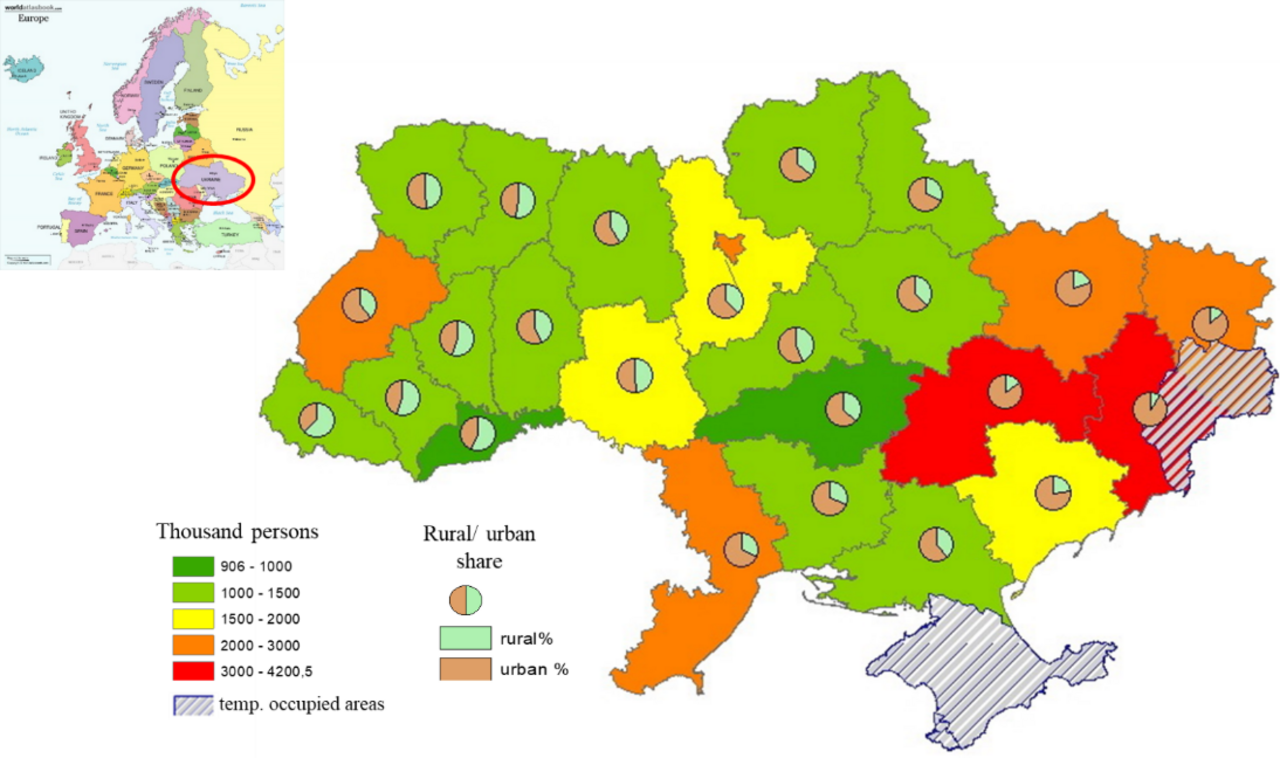
Figure 1: Population of Ukraine per counties (oblasts) and its shares living in urban and rural areas (taken from Medinets et al., 2024).
The agricultural focus in Ukraine centers primarily on crop production, with cereals being the predominant crops, especially for export (corn - 82%, wheat - 65%, barley - 50% in 2017). Sunflowers also played a significant role, with 87% and 75% of produced sunflower oil and meal being exported, respectively. Medinets et al. (2024) quantified that around 7% of domestically produced crop products could adequately fulfill Ukrainian population requirements for plant proteins. However, meeting public demands for animal products necessitates up to 73% of domestically produced items.
Ukraine's N-Footprint - By the Numbers
Wastewater treatment management is a big challenge in Ukraine. As of 2017, 64% of the population of Ukraine was officially connected to wastewater treatment facilities, with lesser amount in rural arias. Moreover, wastewater from one third of this population was left untreated due to malfunctions of treatment facilities. In the most recent report (Renewal, 2022), it was indicated that sewage from about 43% of the people would be cleaned, but only 32% went through a full process of cleaning. Furthermore, most of wastewater treatment plants operated in big towns are outdated with an average efficacy of Nitrogen removal of ~50% (see details in Medinets et al., 2024). Additionally, the official Ukrainian statistics don't show whether the leftovers from treating the sewage were recycled or reused, and if they were, it doesn't explain how it was done.
In 2017, according to the UN Food and Agricultural Organization (FAO), the largest quantities of food products imported by Ukraine were (i) fish, including pelagic fish (267 thousand tons or Gg of fresh weight), demersal fish (92 Gg), freshwater fish (43 Gg), and marine fish (7 Gg), (ii) oranges and mandarins (249 Gg), bananas (238 Gg), palm oil (213 Gg), coffee and its products (159 Gg), milk products (129 Gg), poultry meat (121 Gg), rice and its products (118 Gg).
In the past ten years, Ukrainians have been eating more proteins, about 17-20% more compared to 1999-2001. The types of proteins they get from animals have stayed pretty consistent, ranging between 42% and 47% (see Fig. 2).
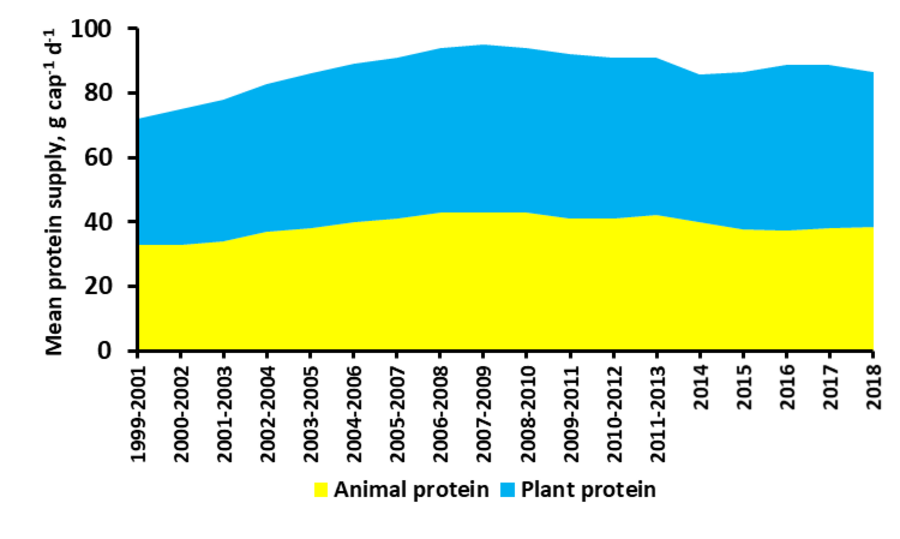
Figure 2: Mean daily protein supply in Ukraine for 1999-2018 (source: FAO).
In the last 30 years since gaining independence, Ukrainians have changed their food preferences. Nowadays, they tend to:
(i) use fewer raw ingredients for home cooking and opt for more ready-to-cook products and fast-food,
(ii) eat more fish and seafood, with this trend increasing each year,
(iii) consume more meat,
(iv) have a preference for artisanal cheeses,
(v) frequently revive traditional and regional food recipes,
(vi) use much less mayonnaise than before,
(vii) incorporate traditional Ukrainian, Italian, and Asian spices into their meals more often.
Researchers have recently figured out the Nitrogen Footprint for the year 2017. You can check out the details in Figure 3 and the original study of Medinets and colleagues (2024).
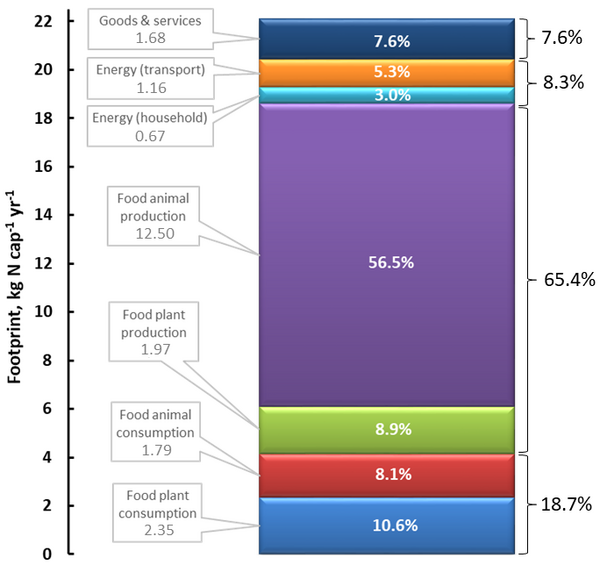
Figure 3: The total annual N footprint of an average Ukrainian for 2017 (taken from Medinets et al., 2024)
Discussion - Total Nitrogen Footprint
In Ukraine, the average Nitrogen Footprint per person was 22.1 kg for the year of 2017. This falls in line with the range (20.1-23.7 kg of Nitrogen per person per year) seen in European Union countries like Austria, Netherlands, and Germany, which have advanced wastewater treatment systems. However, it is lower than the Nitrogen Footprint in countries like the United Kingdom and Portugal, where advanced wastewater treatment was not as well-established, and their range is higher at 27.1-28.7 kg of Nitrogen per person per year (see Figure 4 for details).
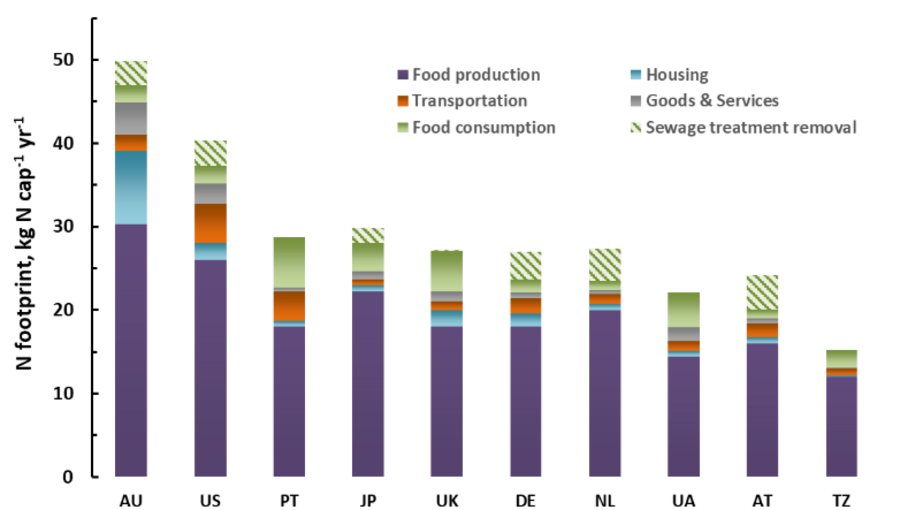
Figure 4: Comparison of country Nitrogen Footprints across the world calculated using N-Calculator approach [AU: Australia; US: United States of America; PT: Portugal; JP: Japan; UK: United Kingdom; DE: Germany; NL: Netherlands; UA: Ukraine; AT: Austria; TZ: Tanzania] (taken from Medinets et al., 2024)
Energy component
The average energy used for homes in Ukraine resulted in a Nitrogen Footprint of 0.7 kg of Nitrogen per person per year. This is similar to the levels seen in Portugal, Germany, the Netherlands, and Japan. Notably, Ukraine's Nitrogen Footprint was 2.5-3 times lower than in Germany and the UK and significantly lower (3-13 times) than in the US and Australia (see Figure 3 for details). Given Ukraine's vast size and its location in a climate zone with warm summers and moderately cold winters (with occasional extremely cold periods), a significant portion of household energy was used for heating, using natural gas, central heating systems, and electricity (see Medinets et al., 2024 for more information).
Transport component
In their everyday routines, Ukrainians generally travel short distances, leading to an average transport Nitrogen Footprint of 1.2 kg of Nitrogen per person per year. This footprint mainly comes from using personal gasoline-powered vehicles and is similar to what's seen in the Netherlands and the UK. However, it is noticeably ~1.5 times lower than the transport footprints in Germany, Austria, and Australia, and significantly lower, ~4 times less, compared to the United States (see Figure 3).
Goods & services component
The Nitrogen Footprint linked to using goods and services was measured at 1.7 kg of Nitrogen per person per year. This amount is higher than what is seen in Western Europe but lower than the levels found in the United States.
Food N supply
In all countries, including Ukraine, the food sector is the main contributor to the overall Nitrogen Footprint, accounting for 84% in Ukraine (see Figure 4). The biggest Nitrogen losses occur in the food production chain, making up 75-95% of the Nitrogen Footprint from food. These losses are mostly influenced by what customers want, like dietary preferences and religious beliefs, as well as the agricultural methods in use (see Medinets et al., 2024).
To evaluate how efficiently and sustainably a plant or animal product is produced, we can use something called the 'Virtual Nitrogen Factor.' This factor shows the environmental loss in kilograms of Nitrogen per net kilogram of Nitrogen consumed during production (more information can be foind in Leach et al., 2012). In Ukraine, we found that the 'Virtual Nitrogen Factors' for vegetables, fruits, cereals, and legumes were either below or close to the lower limit seen in other countries. On the other hand, the 'Virtual Nitrogen Factors' for pork and beef production were higher compared to most countries but were similar to those in Japan (for more details, check Medinets et al., 2024).
Discussion - Where are opportunities for reduction?
Energy component
We can cut down on the environmental impact and save money in individual homes by speeding up the use of renewable energy in Ukraine. The percentage of energy from renewable sources went up from 6.7% in 2017 to 9.2% in 2020. Also, using energy-efficient technologies to insulate houses can make a big difference.
Transport component
To speed up the switch from traditional vehicles to electric ones (or even bicycles) and encourage people to use public transport more, the government can provide incentives. This includes things like giving subsidies and tax breaks for electric vehicles. They can also take steps like improving the infrastructure for electric vehicle charging, creating areas where only low-emission vehicles are allowed, improving public transport, and making better spaces for bicycles. All these efforts together can help reduce each person's impact on the environment and make our cities cleaner. Also, sharing cars, like using car-sharing services or carpooling, is expected to lessen the environmental impact. For example, urban car-sharing could potentially cut down individual emissions from getting around by up to 18% every year (see Medinets et al., 2024 and related references).
Goods & Services component
To reduce nitrogen loss and waste, we can explore the idea of a sharing economy. This means sharing, renting, exchanging, giving away, or donating things, skills, and knowledge directly between people or through community networks, social media, or commercial platforms (see Medinets et al., 2024 and related references).
Food component
Encouraging healthier and more sustainable diets, aiming for an average protein intake of 3.2 kg of Nitrogen per person per year, has been recommended as a specific approach (see EFSA, 2012; WHO, 2007). This can lead to substantial reductions in a person's typical food-related Nitrogen impact, with decreases ranging from at least 22% for an omnivore diet, 33% for reduced red meat, 44% for no red meat, 45% for a demitarian diet, 49% for a vegetarian diet, and 69% for a vegan diet (see Figure 5).
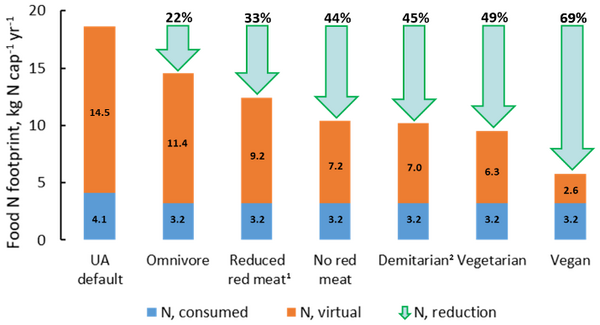
Figure 5. Comparison of food N footprints of a default protein diet in Ukraine as of 2017 and five suggested more sustainable healthy diets utilizing reduced protein intake (3.2 kg N per person per year) according to EFSA (2012) and WHO (2007) recommendations [UA default: a diet of an average Ukrainian as of 2017; 1exclusion of beef, lamb and goat meat from the diet; 250% reduction of all animal products in the diet] (taken from Medinets et al., 2024).
References and useful materials
- EFSA (2012) European Food Safety Authority, Scientific Opinion on Dietary Reference Values for protein. EFSA Journal 2012, 10(2):2557 https://efsa.onlinelibrary.wiley.com/doi/epdf/10.2903/j.efsa.2012.2557
- FAO (2023) The State of Food and Agriculture 2023. Revealing the true cost of food to transform agrifood systems. UN Food and Agriculture Organization. Rome, Italy, 150 p. https://www.fao.org/documents/card/en/c/cc7724en
- Medinets, S., Leach, A. M., Pavlik, T., Medinets, V., & Galloway, J. N. (2024). The nitrogen footprint of Ukraine: why personal consumption matters. Environmental Research Letters. https://doi.org/10.1088/1748-9326/ad1e7d
- UNEP (2021) Food Waste Index Report 2021. Nairobi: United Nation Environmental Programme, 100 p. https://www.unep.org/resources/report/unep-food-waste-index-report-2021
- WHO/ FAO/ UNU (2007) World Health Organization/ Food and Agriculture Organization/ United Nations University, Protein and amino acid requirements in human nutrition; Report of a joint FAO/WHO/UNU Expert Consultation Technical Report Series No 935. WHO, Geneva (2007) https://www.fao.org/ag/humannutrition/35978-02317b979a686a57aa4593304ffc17f06.pdf